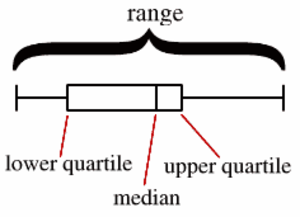
Box and Whisker Plot Statistics deals with data and assumes that these data points in the given set of values are clustered around a central value. The “box” which we refer to in a box and whisker plot reflects the middle half of these data points.


Add a comment...
Your name:
Your e-mail:


About 23

About 23
What is 23 and who's behind the service?
Just In
Discover the world from a different angle.
Here's a crop of the latest photos from the around the world.
Search
Search photos from users using 23
Help / Discussion
Get help or share your ideas to make 23 better
23 Blog / 23 on Twitter
Messages and observations from Team 23
Terms of use
What can 23 be used for and what isn't allowed
More services from 23
We also help people use photo sharing in their professional lives
  • Basque (ES)
  • Bulgarian (BG)
  • Chinese (CN)
  • Chinese (TW)
  • Danish (DK)
  • Dutch (NL)
  • English (US)
  • French (FR)
  • Galician (ES)
  • German (DE)
  • Italian (IT)
  • Norwegian (NO)
  • Polish (PL)
  • Portuguese (PT)
  • Russian (RU)
  • Spanish (ES)
  • Swedish (SE)

Popular photos right now